First issue: 30/11/2014
Pubblication: 04/12/2014
Revision 1: 06/12/2014
Translation: 10/12/2014
Revision 2: 10/01/2015
Translation: 12/01/2015
Recently, on November 14, 2014 Jed Rothwell published a Report about a calorimetric measurement, performed in the period 16 to 24 October 2014, in the laboratory of dr. Tadahiko Mizuno . The document was subsequently revised by Jed Rothwell on November 24, 2014.
Rothwell asserts that calorimetric measurements performed by Mizuno in the year 2013, as presented in a Report of the same year, showed a significant excess heat, but that the used methodology, the isoperibolic calorimetry, was too complex and vulnerable to criticisms under several respects.
Conversely, Rothwell concludes that the calorimetry described in his Report, to which the present analysis applies, is substantially correct:
“There is no likelihood of an instrument error. Only an error in the methodology can disprove these results.“
Since an analysis of the Report convinced us that the methodology was still wrong, we contacted the author to discuss with him the technical content. The discussion was wide and long, but did not lead to any agreement on the issue. Therefore an analysis of ours is presented here which, contrasts completely with that by Rothwell: We think it is also widely supported by the experimental data appearing in the Report.
A simple test (see Note 1) lasting about four hours would have been enough to highlight the error making the present analysis not necessary, but since Rothwell said that the test was unnecessary and refused to ask for Mizuno to perform it, we felt necessary and useful to publish this post.
Adiabatic calorimetry
According to the report, Mizuno adopted an adiabatic calorimetry, or, at least, this was his initial intention. In an ideal adiabatic calorimetry, the system under test is confined within a volume that is completely and perfectly insulated. Once the heat capacity of the whole set up is known –it can be normally calculated with sufficient accuracy by theory (as Rothwell did)- it is very simple to evaluate the heat transferred in a given time t, starting from the measured temperature increase of the whole system.
To get meaningful results, it is necessary that the temperature of the whole system be the same (see Note 2). During the test this was obtained wrapping a long plastic pipe around the reactor cell and connecting it to a Dewar vessel acting as a reservoir.
The water circulating in the pipe transfers heat from the hottest parts in the system to the coldest ones ensuring that all the constituent parts of the thermal mass reach the same temperature. The water circulation was forced by a suitable pump. Obviously this pump coupled some energy to the water thus raising the temperature of the entire system.
Were the system ideal and perfectly isolated, we could observe an overall constant slope temperature increase that, in case of a blank test, would provide an estimation of the power coupled by the pump. Such power would eventually be subtracted from the actual measurement (or neglected if small).
In theory, this principle would be applicable also to a real adiabatic calorimeter, where a certain degree of heat exchange exists. In such a condition, the blank test would change the constant slope straight line to a curve that asymptotically approaches a temperature value at which the heat transferred from the pump to the system equals the heat transferred from the system to the environment. Once again, albeit in a slightly more complex way, it would be possible to deduce the power transferred from the pump. Obviously the evaluation accuracy scales with the thermal isolation of the system.
What is reported above is true provided that ambient temperature is constant. Actually, whereas the changes in ambient temperature do not affect the measurement by an ideal adiabatic calorimeter, the same can not be said for a real one.
When a real adiabatic calorimeter is used, one should always check whether the deviations from the ideal situation are small or large. In the present case, as appearing in the graphs reported by the author, the fluctuations of the ambient temperature even exceeded temperature changes induced by the heat to be measured, and the motor of the used pump required a power 3 times higher than the thermal power to be measured; the hydraulic power declared by the manufacturer was equal to the thermal power to be measured.
In this situation, (which would have been better to avoid) it is highly recommended to analyze any system components to be able to evaluate the influence of each of them on the final result. The fact that Rothwell refused to follow a well-founded methodology appears inexplicable to us.
Temperature fluctuations and thermal inertia
Most of the adiabatic calorimetric systems exhibit very high internal and external time constants. The internal time constant identifies the response time of the system to an input step of thermal energy within the system (the internal heat to be measured); on the other side, the external time constant identifies the step response to environmental temperature changes. The former value is normally quite high because of the fact that the thermal mass is normally high and “distributed” as opposed to a heat source well localized. This means we need to wait enough time to have the heat spread evenly over the entire thermal mass. This time constant should be made as small as possible during the design phase to have a faster response of the system, even if in general it does not affect the accuracy of the measurement.
The external time constant is normally chosen very high on purpose, due to the fact that these systems normally possess a very high insulation value, so that the product (thermal capacity) * (heat resistance) towards the environment is very high. This time constant should be made as large as possible and should be much greater than the period of the fluctuation of the ambient temperature (if present), so that the system acts as a low pass filter and the fluctuations of ambient temperature appear attenuated on the measurement fluid.
This concept becomes very important whenever the fluctuations in ambient temperature are not negligible compared to the temperature change of the measurement fluid.
Unfortunately, these concepts do not seem clear to the author and he does not care that the external time constant of the test system is less than 6 hours, or about one quarter of the period of variation of the ambient temperature while, as mentioned above, should always be considerably higher; even more in this case as the fluctuation of the ambient temperature is very high.
Where does the excess heat come from
The average water temperature during a full day was about 2 °C above the ambient one. Since the system is not perfectly insulated this indicates a heat flow from inside to outside.
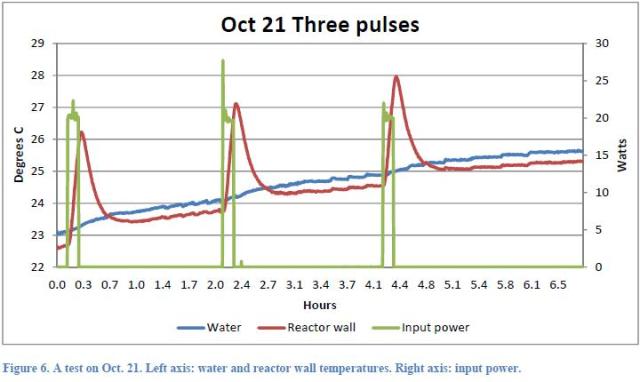
Each test performed during the day by Mizuno, consisted of a variable number of current pulses (1 to 5), applied to an electric resistance made by Nickel or Palladium in a Deuterium athmosphere. Taking into consideration the test of October 21, which is extensively considered in the report, three 20W pulses were applied to the heather, the duration of each pulse being 500 seconds, so that 30.000J of total energy were supplied.
Since the heat capacity of the system was 41.000J / °C (calculated in Report after the content of water and the mass of the stainless steel vessel), this amount of energy would have raised the temperature of an ideal system by 0.73 °C.
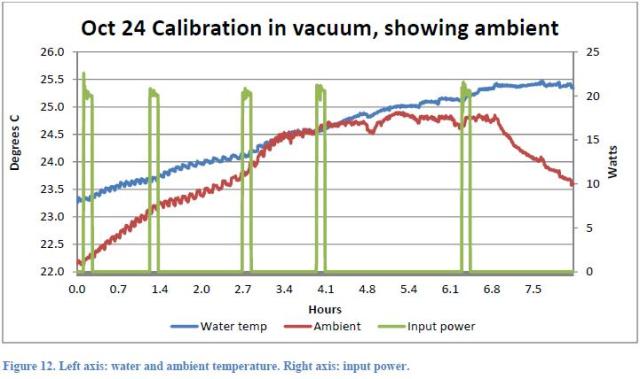
Since the system is not thermally insulated, and the ambient temperature is lower than the water temperature (Figure 12 of the Report)
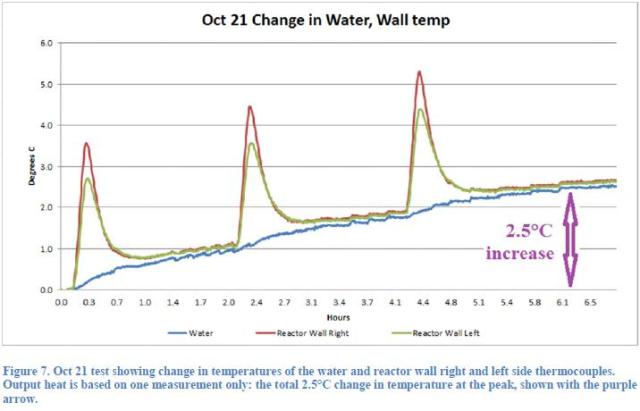
that would lead us to say that, in the absence of other heat sources, the temperature increase must be less than 0.73 °C. Since the temperature increased from the beginning of the first pulse to a maximum after the third peak by 2.5 °C( Figure 7 of the Report),
Rothwell infers that these pulses have triggered an exothermic process in the reactor. If, as supposed by Rothwell the power transferred from the pump to the fluid is equal to 0.25W (see Note 5), the energy provided by the pump to the water in the corresponding period (6 hours) was equal to 5400J, corresponding to a temperature rise of the system of 0.13 °C. The remaining 1.6 °C would be provided by the exothermic reaction that would have produced an average extra-power of approximately 3W.
Furthermore Rothwell asserts that, since the pump was not turned off neither during the night, the power transferred to the fluid is not important, since it simply moves the zero of adiabatic calorimetry (it is an offset). This assertion (true in the case of system with very high external time constants) would lead to estimate about 3.25W of power generated by the exothermic reaction, as indicated in Table 2 of the Report.
We assert, instead, that the power transferred from the pump to the system was much higher: this fact, combined with a strong variation of the ambient temperature and the low external time constant, led to water temperature changes that have been misunderstood and that can be explained without invoking excess heat from alleged nuclear reactions.
At this point it is obvious that it is crucial to know how much heat was transferred from the pump (see Note 3).
Were the calorimeter ideal (no dissipation) it would be easy to deduce the power transferred from the pump to the water. In this case if it were correct that, as Rothwell thinks, power was equal to 0.25W, the heat introduced by the pump during the 24 hours would be 21600J, which would bring the expected increase (always an ideal adiabatic calorimeter) at 0.52 °C in 24 hours.
The calorimeter is not, however, perfectly isolated, so the pump that continuously injects power raises the mean temperature of the water up to a value at which the heat dissipated equates the heat pumped in.
The average difference between the water temperature and the environment during 24 hours is found to be about 2 °C, a value too high (considering the insulation system which, as we will see below we calculated to be about 0.5 °C / W) to be generated by only 0.25W coming from the pump. Even this consideration would therefore seem to confirm the existence of an internal source of heat.
Our explanation is very simple: the water pump dissipates a power far greater than that estimated by Rothwell, approximately 4W.
The fact that the pump dissipates much more than 0.25W , as estimated by Rothwell, and probably about 3.9W is supported by at least three considerations:
1) the used pump has a prevalence of up to 1 m H2O, and a maximum capacity of 8 liters per minute. In the mid-point of its characteristic, the values are: 0.6 m and 4 l / min. The hydraulic power corresponding is: Pi = 0.4W and considering an efficiency of 50% (already very high for pumps of this size), the power transferred from the impeller to the water is about 0.8W, which must be added the heat flowing from the engine (12W) to the water through magnetic coupling.
2) the pump manufacturer (page 5 of the datasheet) states a mechanical power output of 3W (see Note 4).
3) it is possible to estimate the heat transferred to the water from the pump using the same diagrams presented in the report under scrutiny.
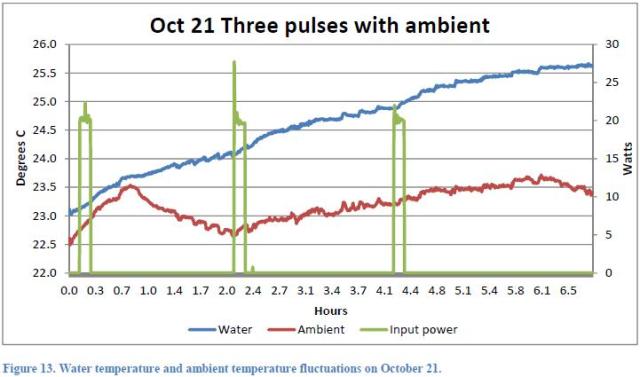
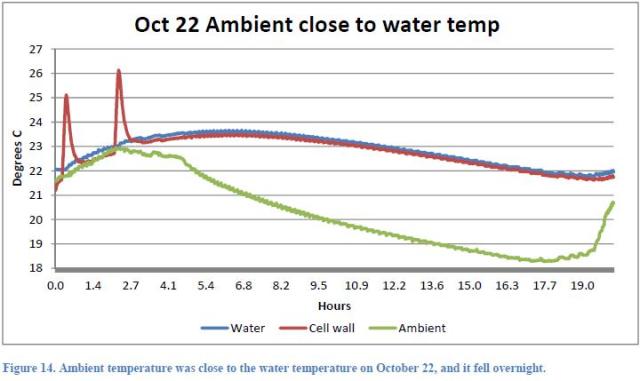
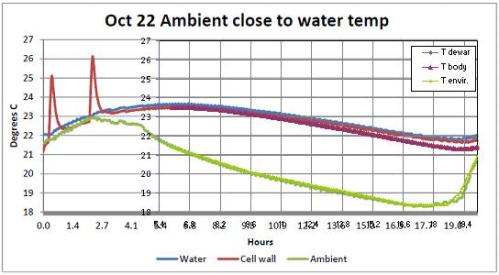
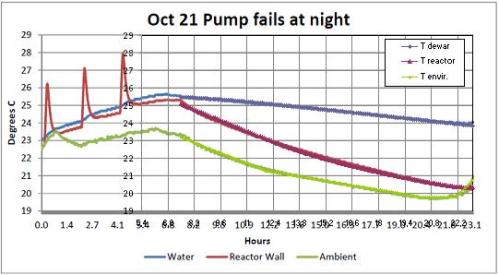
The Figures 13, 14 and 15 of the Report refer to the tests, respectively, of 21 and 22 October.
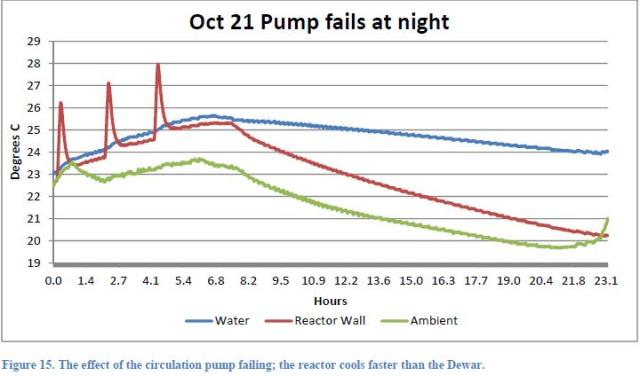
They show the behavior of night temperatures as well. During the night of 21st ( Figure 15 ), the pump stopped due to a fault after 7 hours from the start of data recording.
This coincidence allows us to calculate in a simple way the power transferred from the pump (see Note 2). Consider the two graphs in the period 8.2 – 16.3 (8.1 hours). We focus on energy balance.
In the two cases the thermal mass is different; actually in the case of Figure 14 it is, as already seen, 41.000J / °C, while in the case of Figure 15 (pump not working), the thermal mass is to be divided into two parts as the water does not circulate and the Dewar vessel remains isolated from the rest of the circuit. In this case, according to the report, the thermal mass is 28.000J / °C for the reactor, and 13.000J / °C for the Dewar.
From Figure 15 (pump not running) we can see that in the considered time, the average difference between the internal reactor temperature and the ambient temperature was 1.4 °C and that the internal temperature dropped by 2.7 °C. The average difference between the internal Dewar temperature and the ambient temperature was 3.5 °C and the internal Dewar temperature decreased by 0.8 °C.
From Figure 14 (running pump) we can see that in the considered time, the average difference between the internal temperature of the reactor and the ambient temperature was 3 °C and that the internal temperature dropped by 1.4 °C.
From data in Figure 15 (pump not running), we can write for the reactor:
(a) Power released to the environment = Kr * 1.4
(b) Decrease of reactor internal energy = 2.7 * 28000 = 75.600J
and for the Dewar:
(a’) Power released into the environment = Kd * 3.5
(b’) Decrease of Dewar internal energy = 0.8 * 13,000 = 10.400J
From data in Figure 14 (running pump) we can write:
(c) Power released to the environment = Kt * 3
(d) Decrease of system internal energy = 1.4 * 41000 = 57.400J
From (a) and (b) we obtain: Kr = 75,600 / (1.4 * 8.1 * 3600) = 1.85 W / °C
From (a’) and (b’) we obtain: Kd = 10,400 / (3.5 * 8.1 * 3600) = 0.1W / °C
We get easily Kt = Kr + Kd = 1.95 W / °C
From (c) and (d) we obtain: Ppump * 8.1 * 3600 + 57,400 = 1.95 * 3 * 8.1 * 3600
The pump power equals 3.9W
If we add to this power the power released by the current peaks averaged over 24 hours [30,000 J / (24 * 3600) s ≈ 0:35 W] we can perfectly explain the average daily increase of about 2 °C in the system temperature versus the ambient temperature:
P = Kt * Δ t = (1.95W / °C * 2 °C) ≈ (3.9W + 0.35W) [Watt]
Further confirmation of assessment errors in the Report
There are four more indications of no excess heat. First, if you look at Figure 12
You can see that at the very left, before the start of the first pulse, the water temperature is already rising with a slope nearly identical to that which is maintained throughout the test period, until the end of the third pulse. The same thing is seen in Figure 6
where we see also that the temperature of the inner wall of the reactor starts increasing before the beginning of the first pulse. This shows that it is not a nuclear reaction triggered by the peaks of electrical power input to generate the rising temperature of the fluid, but it is the heat exchange with the ambient temperature which is higher with respect to the night of about 3 °C as can be seen from Figure 14 (even if this refers to the following night). This point seems not to be clearly understood by Rothwell who answered the question by saying that this would be contrary to the second law of thermodynamics.
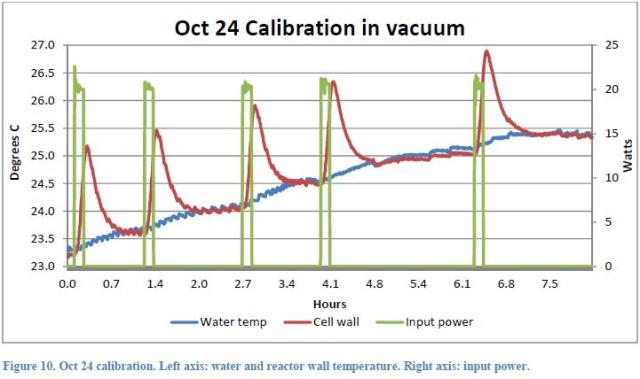
The second indication is given by Rothwell himself: as well during the vacuum test (that should not produce any excess heat), a significant “excess heat” (approximately 1.5W) was measured. Rothwell believes that despite vacuum conditions, a modest nuclear reaction has taken place. We are not able to provide a full explanation about the fact that in this test under vacuum the temperature raised to a value about 1 °C lower than that obtained in the actual test, since we do not know exactly the difference between the two tests. Certainly, in this case 5 current pulses were used instead of 3 (Figure 10 )
And this fact has led to a larger increase of the system temperature so that subsequently less heat from the environment is received. It is not clear why during this test, it was decided to adopt a higher number of pulses. Also the fact that the x-coordinate is not an absolute time, does not help to understand at what time of day the various tests have taken place. Clearly, since the heat exchange between the air and the system is related to the temperature of the air and this varied by some 2.5 °C during 24 hours, tests carried out at different times can give a different increase of the water temperature.
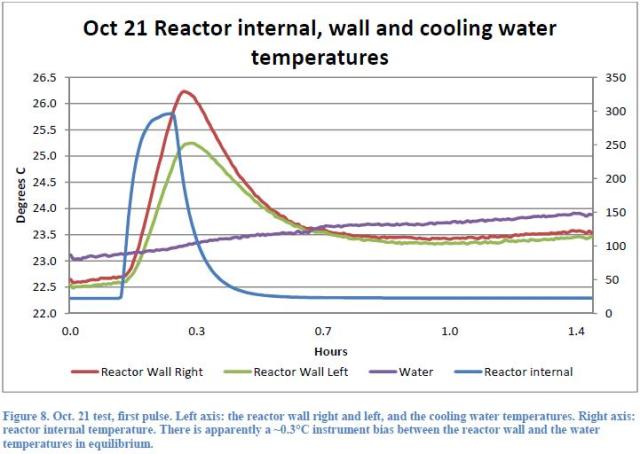
The third indication relies on the fact that in all cases the temperature of the reactor is lower (even if slightly) than the water temperature (see Figures 8 , 13 and 14 ).
This would be a nonsense if the heat came from a nuclear reaction inside the reactor, whereas it is obvious when you consider that the ambient temperature, higher during the day when you run the tests, is providing energy to the water that circulates outside the reactor and the Dewar: the water itself transmits the heat to the reactor which stays always a bit cooler.
The fourth indication as well refers to the analysis of Figure 7.
If you look closely at the trend of the reactor walls temperature; you may note initially the sharp rise in temperature due to the application of the electrical pulse, what should have triggered the nuclear reaction. Subsequently, the wall temperature falls during a cooling phase to reach a value of relative minimum which represents the depletion of the thermal transient. From that value of the minimum wall temperature should remain almost unchanged, but in reality this happens only for a short period (while, instead, the water temperature continues to rise with its slope fairly constant) and subsequently we note, however, that the wall temperature continues increasing faithfully following the thermal evolution of the water temperature. This behavior thus leads to deduce that the temperature of water determines and imposes the temporal evolution of the temperature of the reactor walls and not vice versa as the Report would like to demonstrate.
Conclusions
From what we said above, one can concluded that the reported measurements do not show any evidence of anomalous heat: The allegation comes from a poor interpretation of the data collected from the system. The error finds its basis in the fact that the adiabatic calorimetry was assumed to be ideal: that is, very well insulated, and insensitive to variations in ambient temperature; moreover, a negligible power coupled by the pump to the circulating water. A simple calorimetric test with only the pump, to the author refused this suggestion of ours, would have immediately shown the error.
—
Considerations added on 06/12/2014
In a recent e-mail, Jed Rothwell asks our Group to insert some considerations written in his e-mail. In the following you can find the consideration coming from Rothwell and our replies.
JR-1) “…With this method of adiabatic calorimetry the 0.6°C temperature increase over ambient is not included in the calculation of excess heat, because the pump is left on all the time, and it always does the same amount of work, so the temperature is always 0.6°C above ambient. To be specific, with this method, the starting water temperature is subtracted from the ending water temperature, and the starting temperature is already 0.6°C warmer than ambient.
With other methods of calorimetry, heat is measured by comparing the reactor temperature to ambient. With these methods, heat from the pump has to be subtracted from the total, or it will be mistaken for excess heat.“
GSVIT-1) We do not agree at all. The pump was not stopped during the test and, as Rothwell says, we are speaking about a differential temperature increase equal to +2.5°C. Additional heat coming from the pump increases the final result; that is, the ΔT considered by Rothwell to be the smoking gun of the alleged production of anomalous heat. Obviously, this is valid until thermal equilibrium is reached.
JR-2) “Regarding Fig. 12 you note correctly that the temperature of the water was rising before the first pulse. That is mainly because the ambient temperature was rising.“
GSVIT-2) This statement is exactly in the line of our Post: the system external time constant is too short when compared to the external temperature change period: Actually it is true that the water temperature (as Rothwell is saying in his e-mail) changes due to an ambient temperature fluctuation.
—
Note 1 As you will see in the analysis, the setup by Mizuno used a centrifugal pump driven by 12W electric motor that Mizuno himself measured to absorb 10W. The power fed into the water from the pump is completely neglected in the report. The motivation for this choice was due to the fact that Rothwell had estimated a very low power, around 0.25W. The characteristic curves of the pump show that the hydraulic power the pump is able to provide is 3W and the same manufacturer indicates that power as “output power” in the datasheet of the pump . When such data were presented to Rothwell, he argued that the pump had been working with a flow rate of 8l / min without any back pressure, so the coupled power was virtually zero. The pump actually was pushing the water in a plastic pipe of the length of 16m and a diameter of 10mm. An approximate calculation of the pressure drop leads us to say that in those conditions the actual flow rate was 1 l / min and that the curve (which has a maximum head of 1m) worked at the extreme left of the curve. Actually, this position is effectively the position of minimum power consumption for a centrifugal pump contrary to what Rothwell thought believing that the minimum absorption were at the right end. In any case, in addition to the power coupled to the water by the impeller, there is a part of heat that is transferred from the engine to the water through the magnetic coupling used in this type of pumps, heat that Rothwell neglects without being able to bring any justification. Actually he tries to support his claim by arguing that the engine was hot, while the pump was at the water temperature. This assertion is, of course, obvious and clearly can not indicate how much heat is flowing from the motor to the pump; but that concept seems not understandable by Rothwell. Since the Mizuno setup used a very well insulated Dewar flask, we proposed them to perform a measurement of the power delivered by pump to the circulating water simply by closing the circuit outside the Dewar with insulated pipes as short as possible (although it would have been more appropriate to include a localized pressure loss equal to the pressure drop of the actual circuit in order to make the pump work at the same point). Rothwell defined this test useless and refused to ask for Mizuno to run it.
Note 2 Alternatively, one can take temperature measurements of the all the various parts of the system that are supposed to stay at different temperatures (typical method of isoperibolic calorimeters). This procedure has the advantage of not requiring a fluid to make the system temperature uniform, but requires knowledge of the heat capacity all over the system, what is not always easy or feasible; for this reason the choice of having circulating water is entirely acceptable.
Nota 3 Rothwell attempted as well, in a further communication, to perform this calculation, but it is unclear to us which system he used since he came to the conclusion that the power loss was only 0.25W.
Nota 4 Rothwell indicates an Iwaki MD6 magnetic drive pump, that, as per datasheet, incorporates a 22W motor; afterwards, in a private communication, he informed us that actually the setup used a slightly different pump, powered by a 12W electric motor.
Nota 5 Rothwell (in a subsequent calculation) concludes that the pump would released at most 0.4 W power. He does not exclude that the real power delivered by the pump could be even higher (no more than 1W) but he considers this possibility highly unlikely.
We thank the author of the Report, Jed Rothwell, for allowing the GSVIT to freely use the contents of his document.
Appendix: Further analysis with numerical simulations
To further verify what is presented above, a simulation was carried out in order to reconstruct the experimental temperature curves as a function of time. The simulation was carried out for the tests shown in Figures 14 and 15, using the equation of the thermal equilibrium of a body:
– M c P dT + P dt – KT (T – Tenv) dt = 0 (eq.1)
where:
- M cP is the Heat Capacity (Mass x Specific Heat) [J/°C]
- P is the Power [W]
- KT is the overall Transmittance (Transmittance x outer Surface of the system) [W/°C]
- dT is the Temperature interval
- dt is the time interval
Introducing the internal time constant, cT = M cP / KT, the above equation can be rewritten in the following way:
P / KT dt = cT dT + (T – Tenv) dt (eq.2)
The first simulation provides the curves Tdewar and Tbody versus time, shown in Figure 14 in the original Report by Jed Rothwell, starting from the sixth hour of the test (night phase). The curves were obtained by numerically solving the equation (1) with the following parameters:
- t = 6h → TD = TB = 23.5 °C
- M cP = 41000 J/°C
- P = 4 W
The room temperature has been interpolated by means of several linear correlations to describe the actual measured curve. K T instead has been considered as a fitting parameter.
Figure A1 below shows the simulation results obtained with KT = 1.95 W/°C: the simulation graphs are superimposed to those in the test report by Rothwell. It is to be noted that the curves are almost indistinguishable and are obtained taking a pump power equal to 4 W.
Subsequently, data of Figure 15 was reconstructed with the same procedure using the equation (1) written both for the dewar vessel and the reactor body:
MD cP,D dTD = – KD (TD – Tenv) dt (eq.3)
MB cP,B dTB = – KB (TB – Tenv) dt (eq.4)
It is important to note that during this test, the power terms are zero since the pump failed and the reactor was off.
For equation (3) the following parameters were considered (taken from the original report):
- t = 7.5 h → TD = 25.5 °C
- MD cP = 13000 J/°C
- KD = 0.1 W/°C
whereas for equation (4) the following:
- t = 7.5 h → TB = 25.1 °C
- MB cP = 28000 J/°C
- KB = KT – KD = 1.85 W/°C
The following figure A2 shows the plots obtained using the above described model; as previously, the test graph and the simulation are superimposed:
It can be seen from this graph, a good agreement of the model results with the experimental ones (practically indistinguishable); this is a strong confirmation of our analysis previously reported in the present post.

Rothwell argues that the pump is always on, with constant back pressure, so the offset in temperature that it creates would cancel out, because the calorimetric calculations use temperature rise, and are not, then, influenced significantly by such an offset of both start and end temperatures. So he may have been incorrect about total pump heating power, but I do not see that you answered his point, only his possible error about that power. Comments?