
First issue: 24/12/2014
Pubblication: 05/01/2015
Translation: 07/01/2015
This article reports the verification activities and the calorimetry measurement performed on the pump used by Tadahiko Mizuno during his recent measurement of the alleged anomalous heat due to LENR, which was discussed in our previous published analysis; according to our opinion and measurements the origin of the so-called anomalous heat, claimed by Mizuno and Jed Rothwell as due to a LENR phenomenon, is instead simply due to clear errors in measurement and evaluation of the involved parameters.
We have to remember that the Mizuno experimental set-up was checked and confirmed by Jed Rothwell who published his findings in this Report where he testifies that the pump used was:
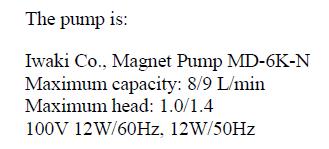
Figure 1 – Pump used by Mizuno after Rothwell report
In his report Rothwell says that the power dissipated by the pump was less than 0.5W, probably 0.25W, but certainly less than 1W.
In order to demonstrate which are the real and actual values, we got exactly the same model of pump used by Mizumo and Rothwell:
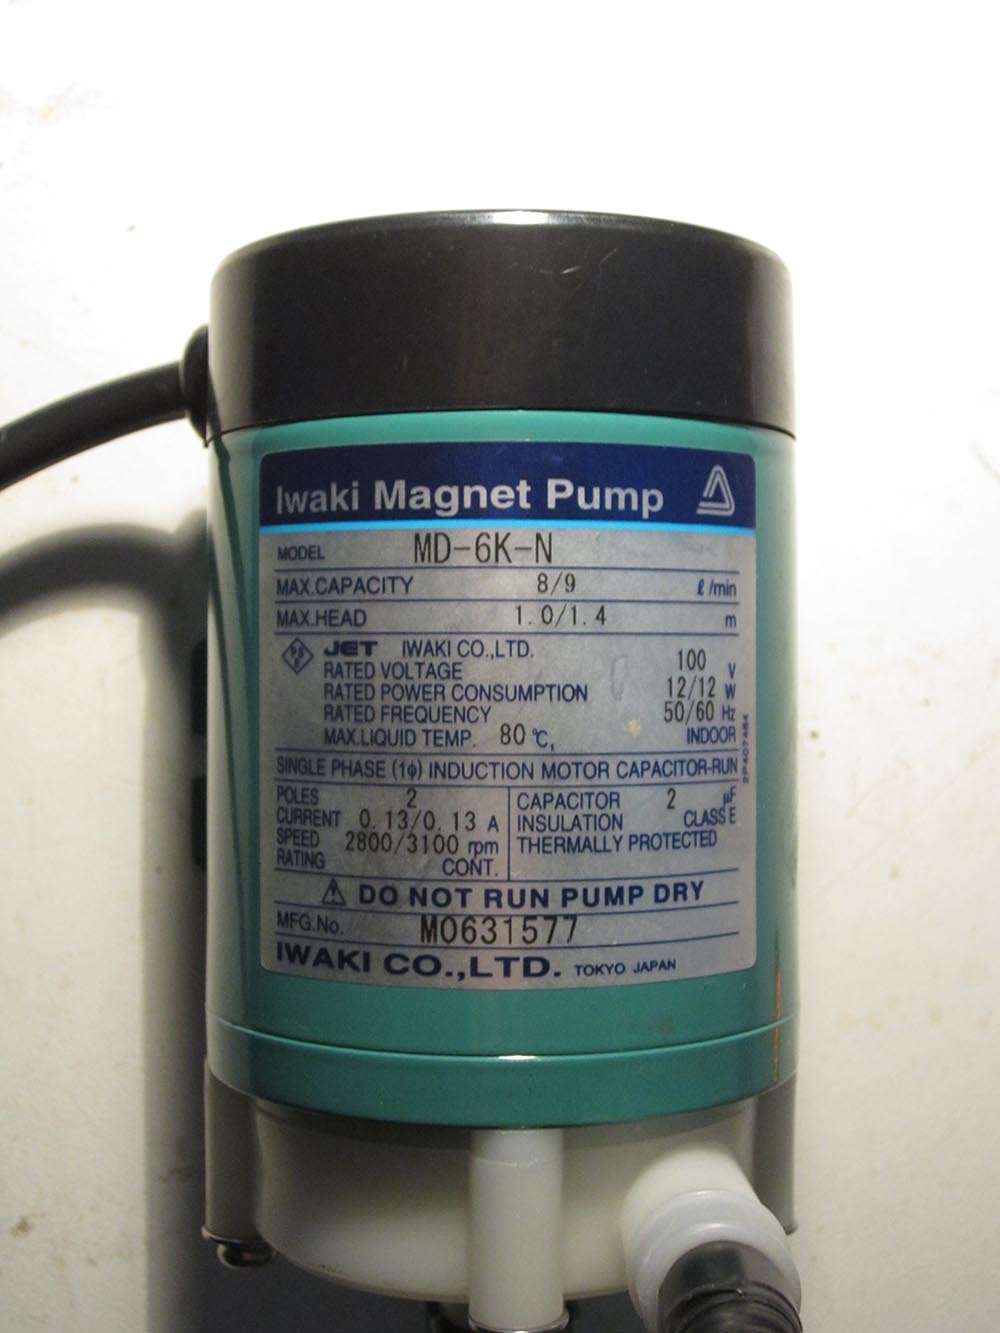
Figure 2 – Iwaki MD-6K-N pump
We performed a calorimetry measurement in order to evaluate the actual heat released by the pump. We used exactly the same adiabatic calorimetry method (the one originally used on the cell by Mizuno and Rothwell) confirming that this type of Calorimetry, if well done, allows precise and reliable measurements to be obtained.
Our calorimetry measurement showed that the pump dissipates 4.3W into the water, in line with what expected from our previous analysis of the theoretical data in the report by Rothwell.
It is then confirmed that in the Mizuno reactor, originally presented at the ICCF-18 conference, and measured via different calorimetry methods during 2013 and 2014 with the collaboration of Jed Rothwell, the excess heat claimed and attributed to LENR is instead due to the water pump dissipation in association with strong fluctuations in ambient temperature between day and night.
Measurement method description
The method used to measure the heat transferred from the pump to the water is extremely simple and did not require more than an afternoon of work. The same method had been previously suggested to Rothwell who refused to ask Mizuno to run it.
In Figure 3 one can see the simple set-up:
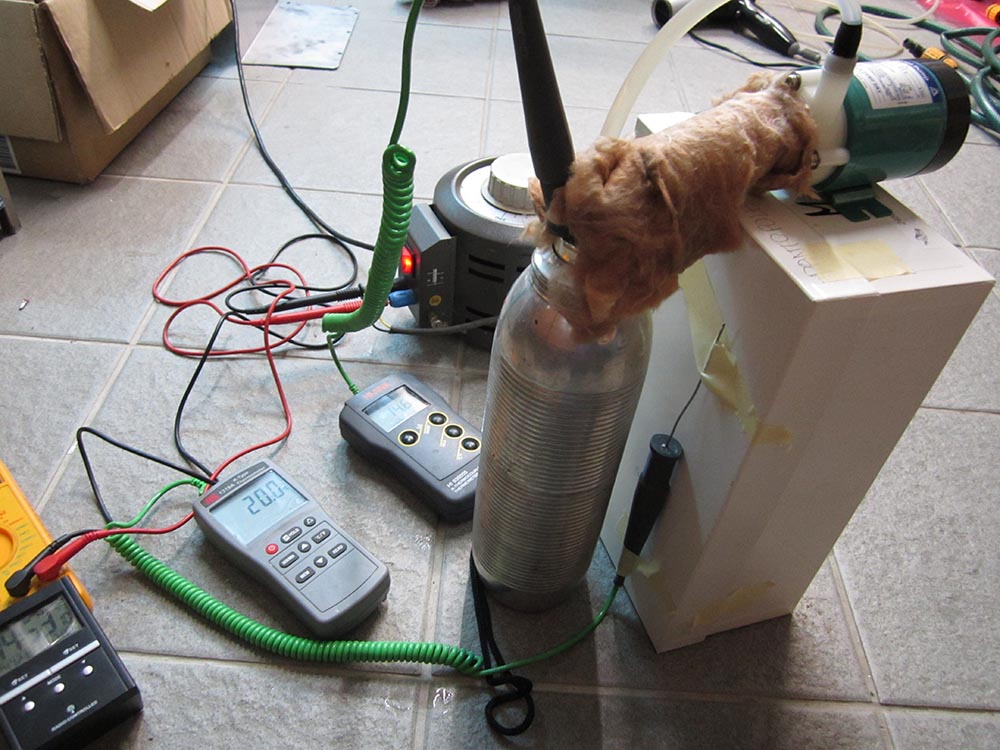
Figure 3 – Set-up
The pump makes water pass through a Dewar vessel by means of an external hydraulic circuit. The total amount of water was 800g and the heat capacity of the container was neglected. Although not essential, to increase the accuracy we used as external pipe a silicon tube with a 5mm inner diameter, and 40cm long in order to make the pump operate on the same working point in the PQ diagram.
In fact, as we know, for a given flow rate the pressure drop in a pipe depends, as a first approximation, on the inverse of the diameter raised to the 5th power. Since the Mizuno cell used a 16 meters long pipe with a 10mm inner diameter, we could obtain the same pressure drop by using about 0.5m of 5mm pipe. In the actual test, due to height problems the length was reduced to 0.4m.
Since the pump, built for the Japanese market, required a 100V 50Hz power feeding, we used a Variac, monitoring its output by means of a voltage tester. A preliminary simple test was performed to check if the Dewar vessel heat loss was really negligible. So we put inside 800g water at about 30 ° C, waiting about one hour to have the temperature stabilized; then the water temperature decrease was recorded during a 45 minute period.
The details are as follows:
- Initial temperature: 28.0 ° C
- Final temperature: 27.1 ° C
- Room temperature: 21.0 ° C
These data provide a heat exchange coefficient K: = 0.15W/°C that is more than acceptable for the test, as long as operation is kept at temperatures not very far from the room temperature.
Before the test, the pump was preheated for about an hour in order to evaluate the water flow (see Figure 4).
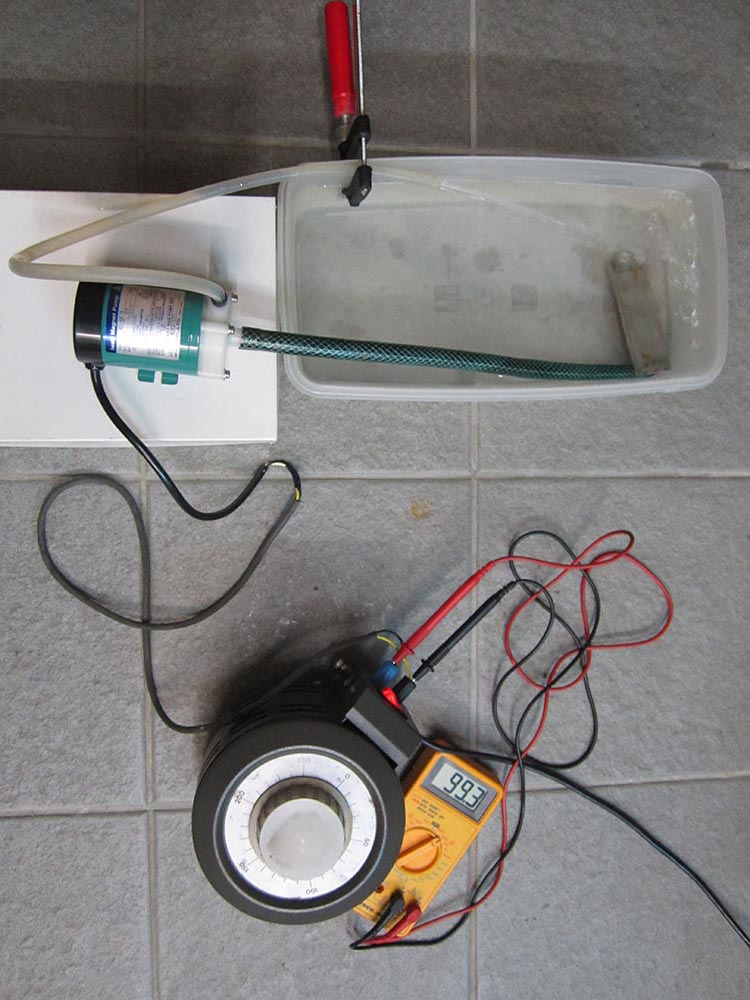
Figure 4 – Pump preheating phase
Then a simple set-up was prepared with continuous reading of water and ambient air temperatures by two different thermometers.
The hydraulic circuit was then loaded with 800g of water at 14 ° C, and the pump was started [it is not self-priming] (see Figure 5).
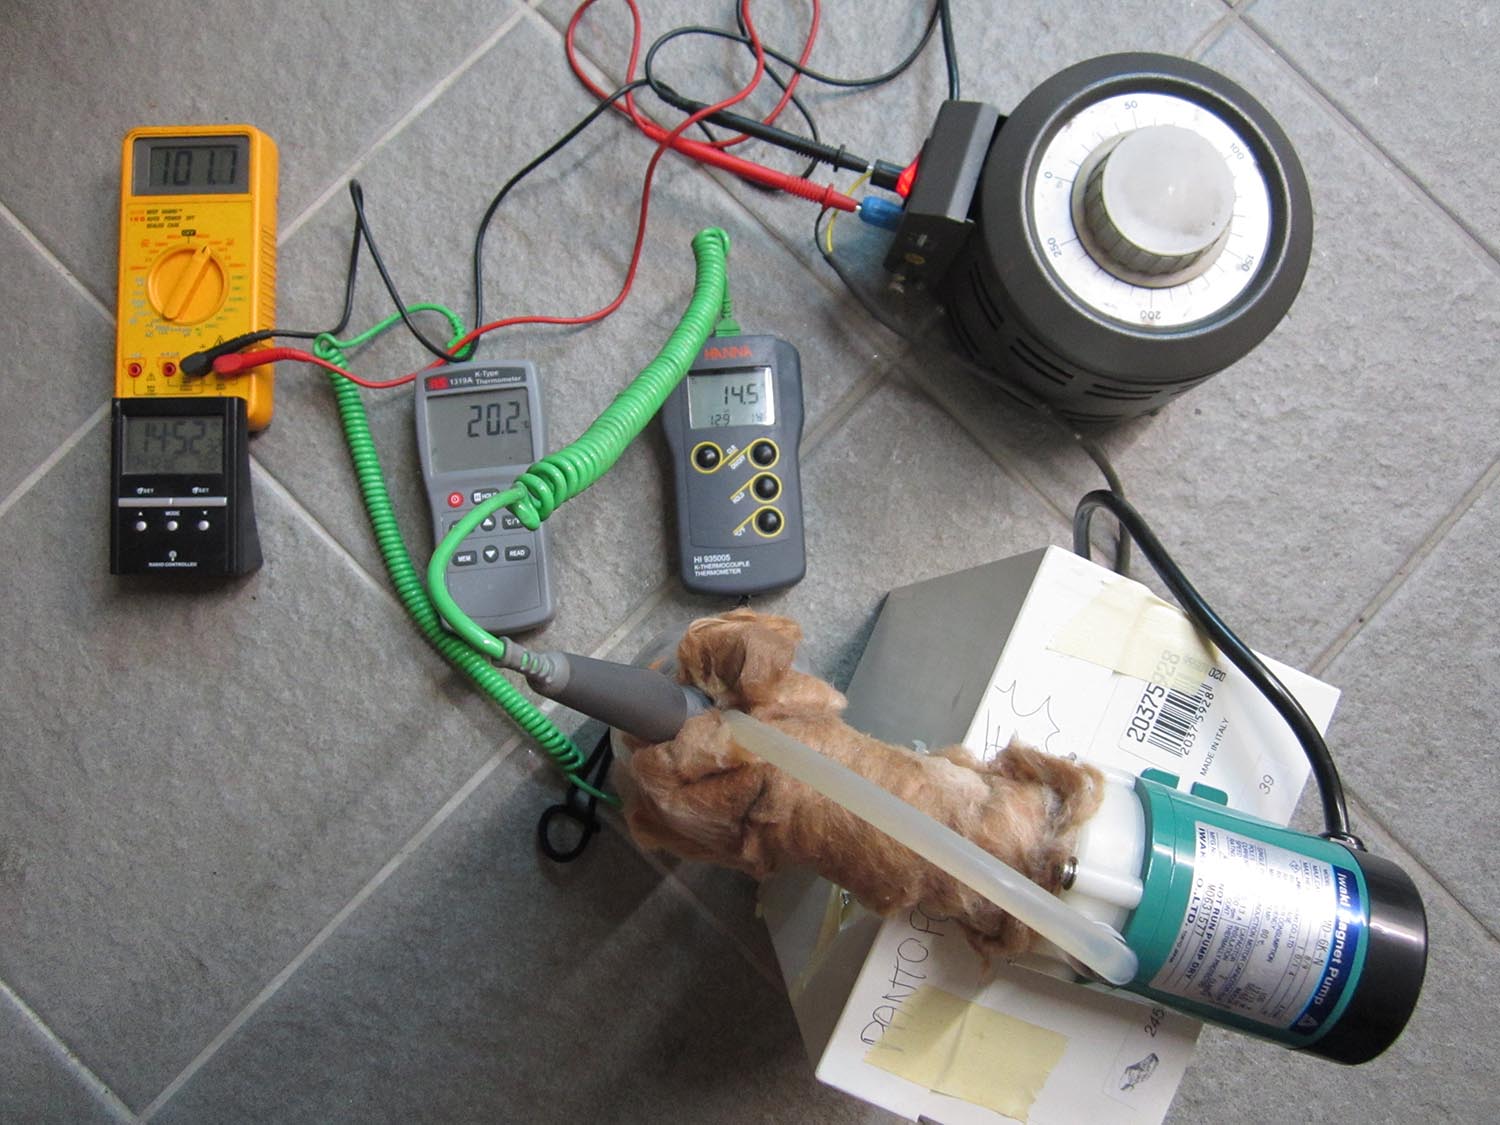
Figure 5 – Beginning of test
We had to wait about an hour to have the water temperature close to room temperature; then data were collected through successive photographs. Figure 6 and Figure 7 show the values used in the final calculation.
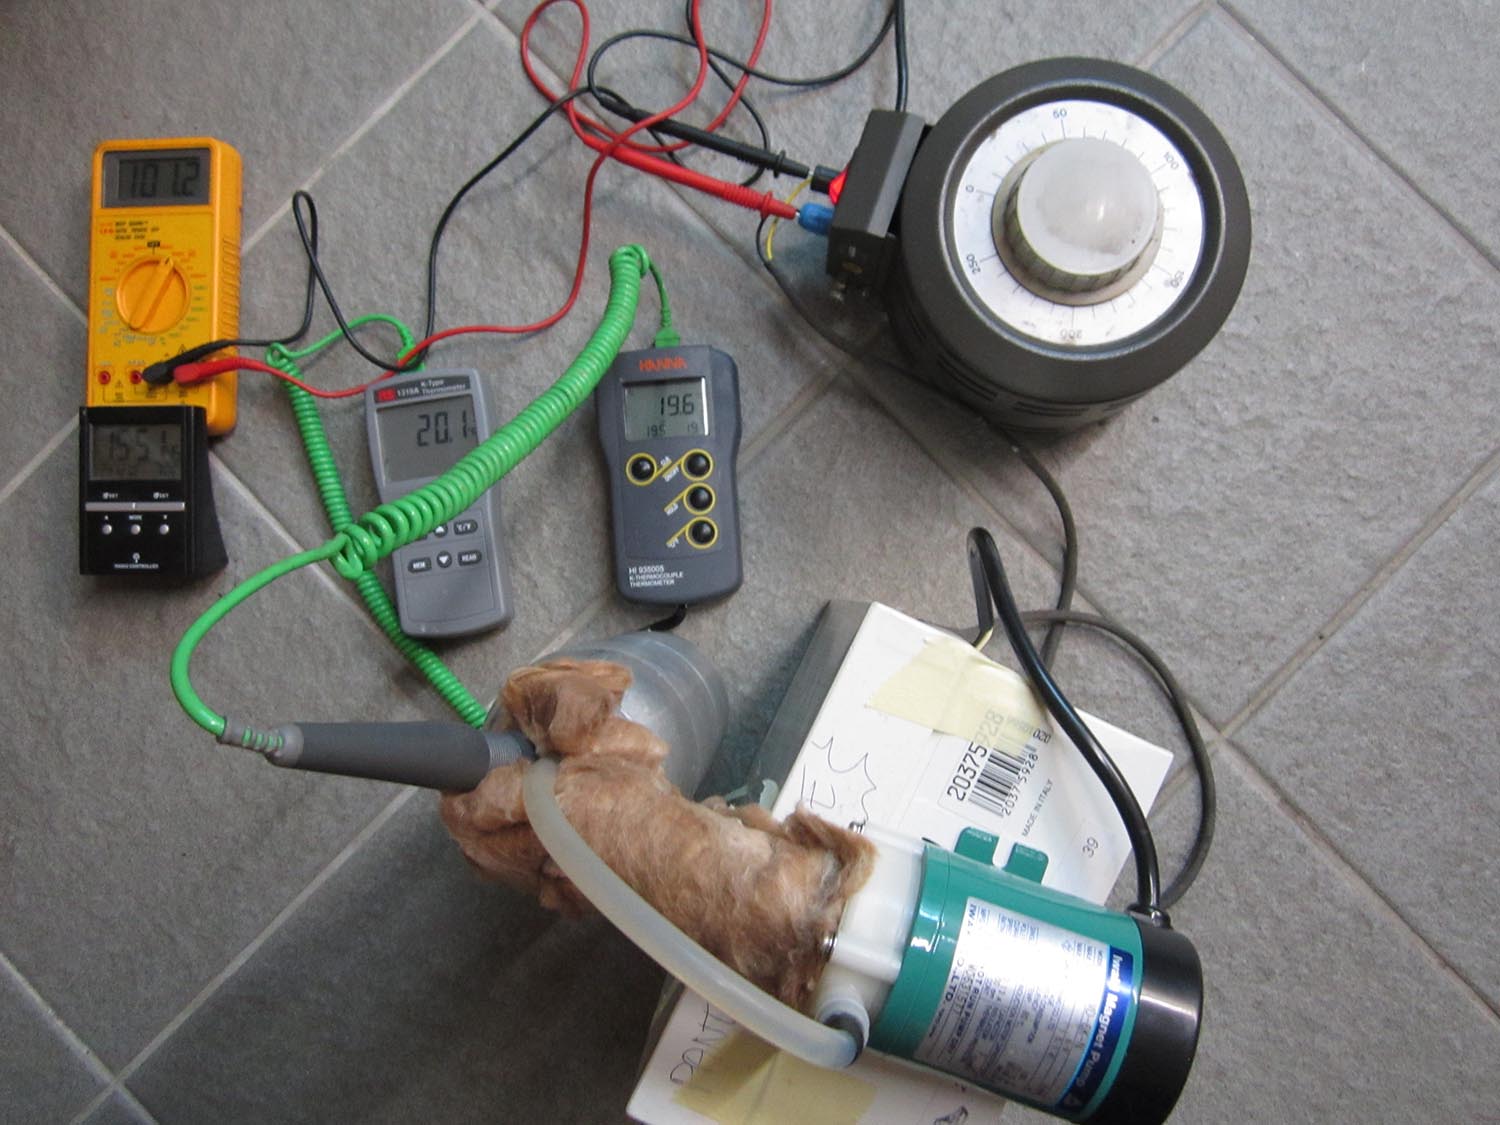
Figure 6 – T1 Temperature
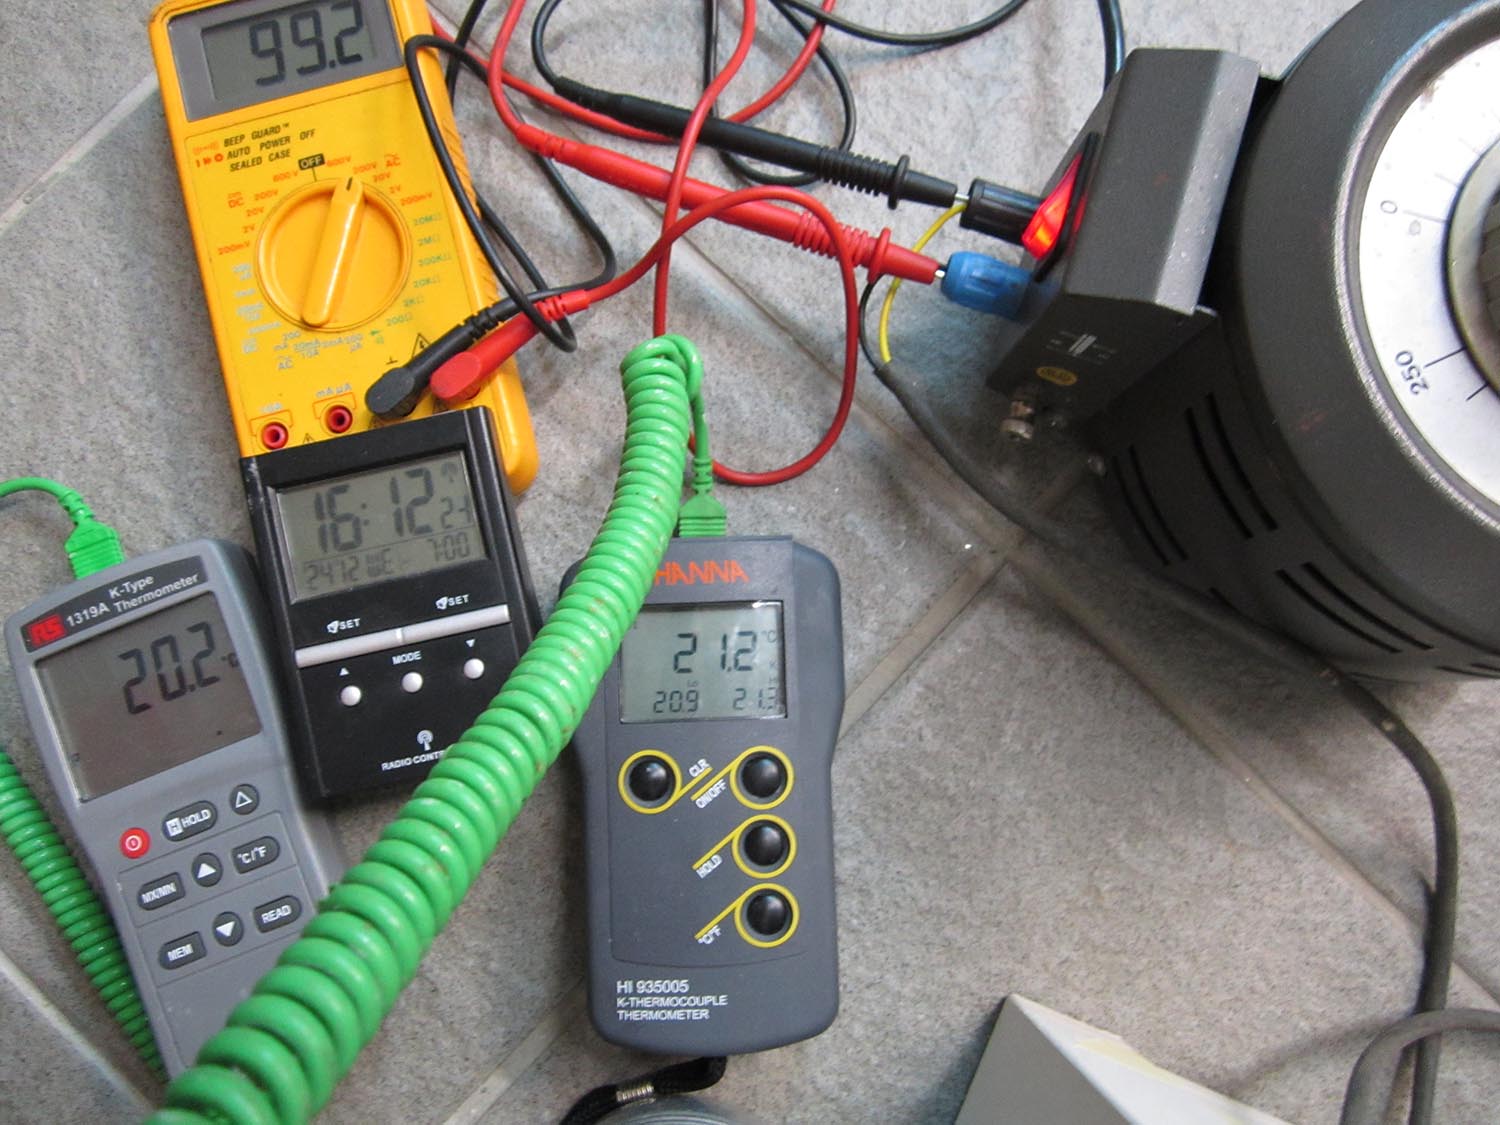
Figure 7 – T2 Temperature
At the end of the test the two thermometers showed the same values (see Figure 8).
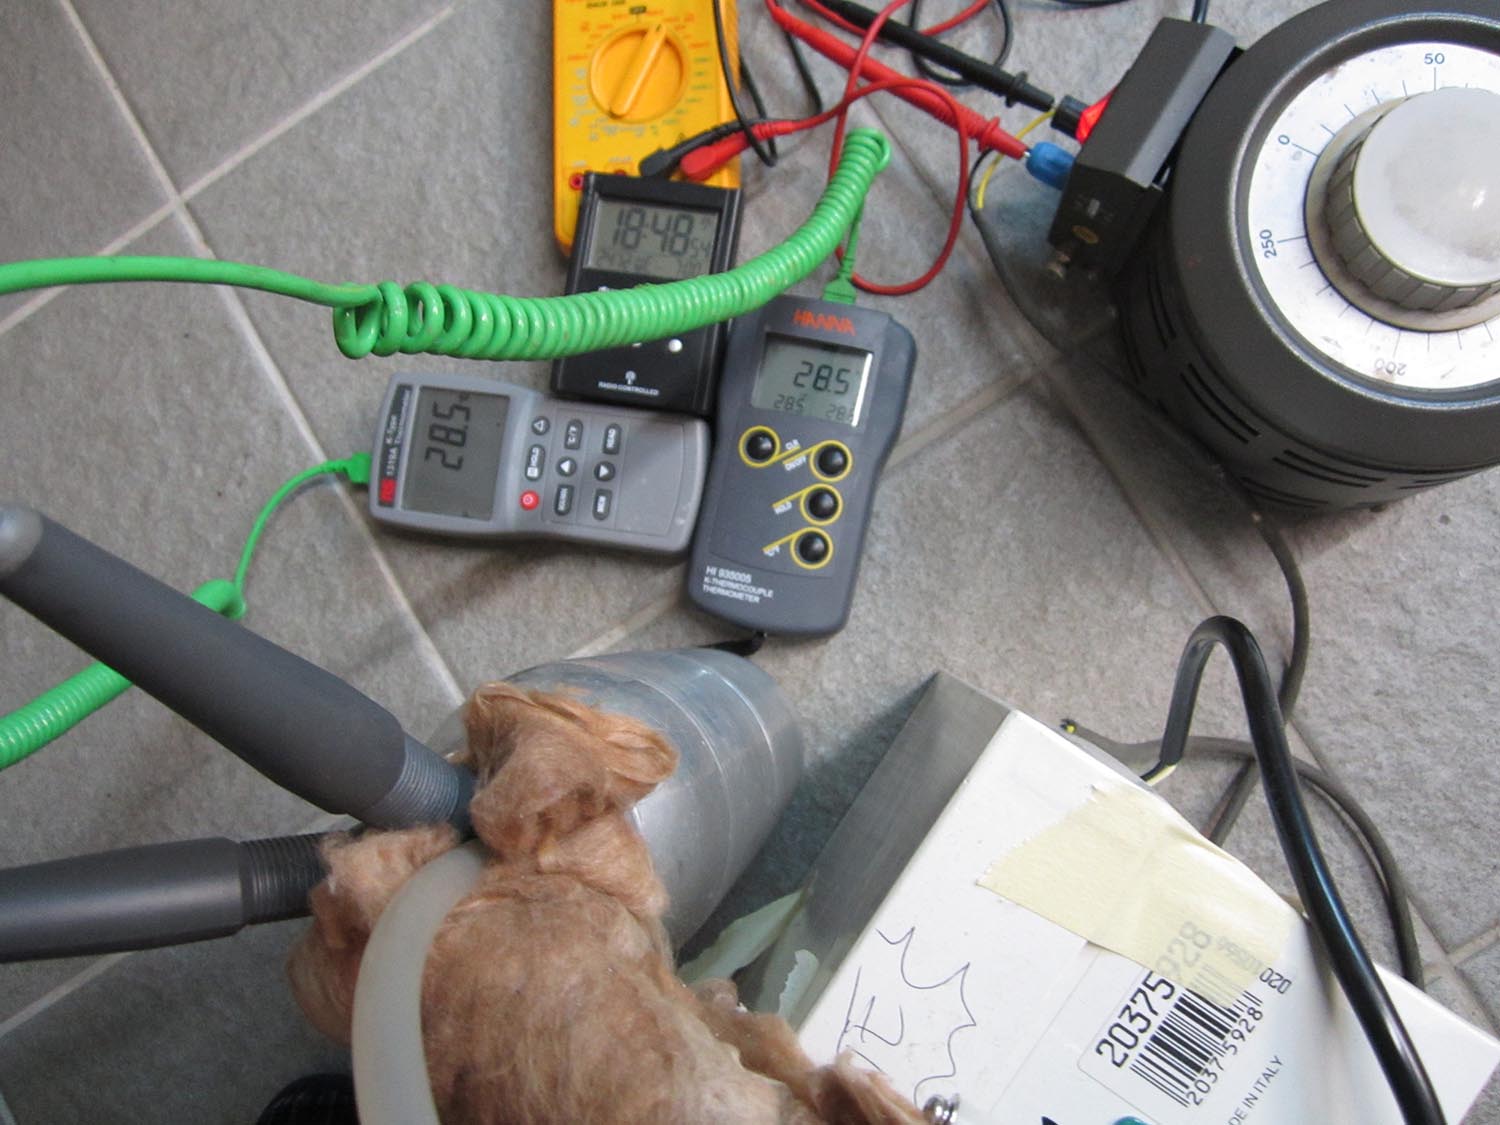
Figure 8 – Control thermometers at the end of the test
At the end of the test the two thermometers showed the same values (see FiguThe pump motor temperature was measured as well; it was found to be 45 ° C (see Figure 9).
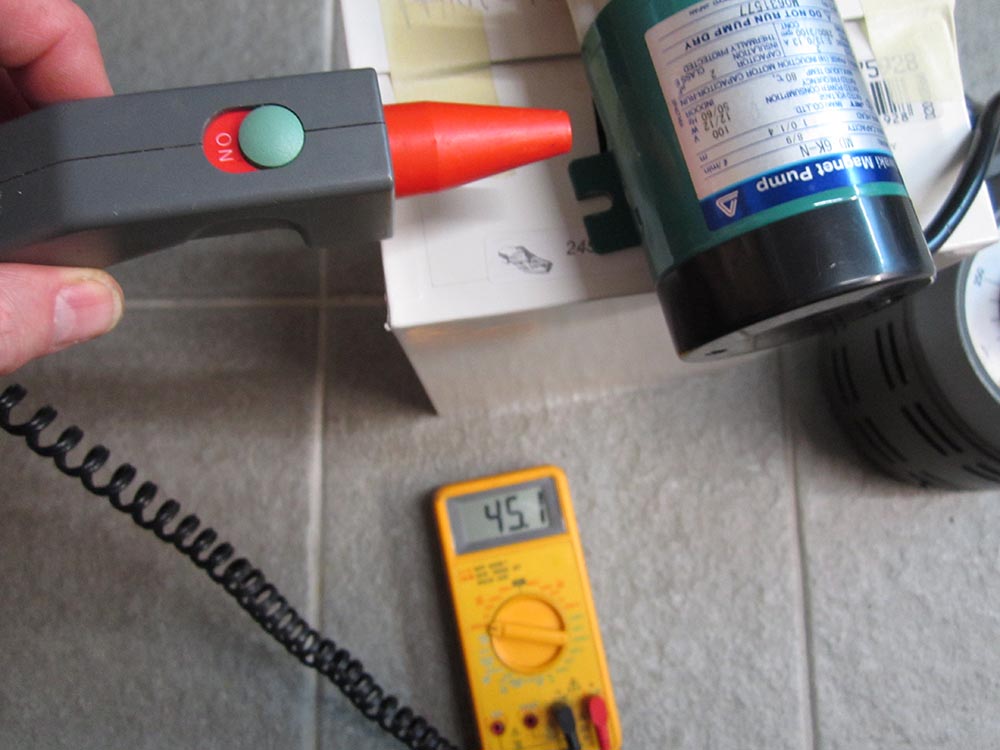
Figure 9 – Pump motor temperature
Figure 10 shows the time evolution of measured temperatures.
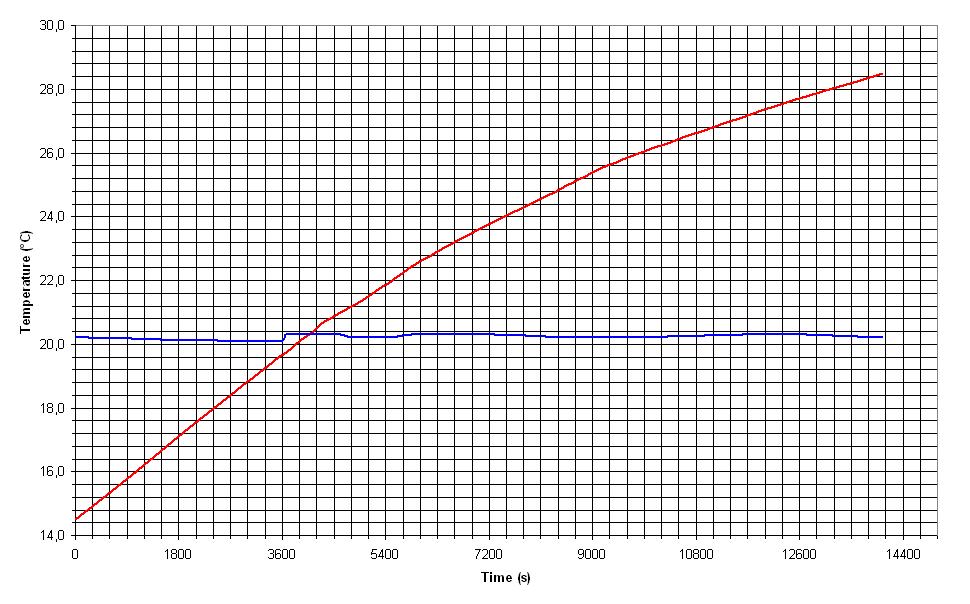
Figure 10 – Measurement diagram
The power P transferred from the pump is given by:
P = 4183 x 0.800 x (T2–T1) /t
where:
- 4183 is the specific heat of water @ 20°C [J/kg°C]
- 0.800 the mass of water to be heated [kg]
- T2 is the final temperature [°C]
- T1 is the initial temperature [C°]
- t is the time interval between the two measurements [s]
Considering the values obtained from the two photographs (Figure 6 and Figure 7) taken at 0.5 ° C below (T1) and 1.0 ° C above (T2) the ambient temperature and taken respectively at 15:51:45 pm and 16:12:24, [that is at an interval of 20 minutes and 39 seconds], one can calculate that the power transferred from the pump to the water is equal to 4.3W, i.e. 0.4W higher than what we estimated theoretically in our previous Post. The difference is due to the conservative choices adopted there.
Conclusions
Calorimetry measurement performed on the same pump model used by Tadahiko Mizuno has confirmed that the pump dissipation is an order of magnitude higher than that assumed by Jed Rothwell: as such it can explain exactly the apparent excess heat measured.

Jed position:
“I saw that. I think that’s the fellow I have been corresponding with. I sent him the calibration curve with the pump only, from p. 25, showing that it is adding roughly 0.4 W, but he did not buy it. It is a little hard to see how Mizuno’s device would produce only 1.9 W and 1.6 W in the last two tests if the pump is supplying 4 W.
”
I suspect he does not buy your position more than you buy his.
Maybe you miss something with Mizuno setup that the calibration curve caught.
Or you have an undefined artifact. 😉
This is very important as sure one of the two have made a big mistake.
Future will say.
On 06 January 2015 dr. Jed Rothwell wrote:
“… I think that’s the fellow I have been corresponding with. I sent him the calibration curve with the pump only, from p. 25, showing that it is adding roughly 0.4 W, but he did not buy it. It is a little hard to see how Mizuno’s device would produce only 1.9 W and 1.6 W in the last two tests if the pump is supplying 4 W.”
and on 07 January 2015 also wrote:
“…I do not have the time or the inclination to deal with such people.”
===
Yes, we preferred not “buy your calibration curve“, just after our first Post published we bought directly that pump and measured it as shown, giving a lot of details. This should be always the correct way to work when a scientific test activity is performed.
We got results confirming previous analysis and our result (about 4W) is also quite in accordance to what declared by the manufacturer of the pump in the relevant data-sheet, and this is a fact.
Anyway, as in past, we are always open to hold a scientific debate, giving all due technical evidences.
did you consider that mizuno setup that was calibrated was different from yours ? insulation different, pressures different from estimated…
or you say he faked the calibration…
how can you explain the difference, if not by a fraud or by an error in replicating ?
sure that is yet another evidence of international conspiracy.
Of course I don’t consider symmetrical hypothesis. I know scientist are honest except in LENR.
I also don’t imagine you made error because scientist like you don’t make errors like LENr experiments.
Thanks for having moderate my previous message wher I relay Jed and requoted it here as you like.
I understand Jed reaction.
Message to the nickname “AlainCo”
First of all read carefully the rules to get a comment published here.
You must write the comment using your complete, real and clear NAME and SURNAME to obtain a comment posted here, not any “nick” or any kind of abbreviation is allowed.
Your two comments published were a once exception because, maybe, you are ignorant and not familiar with our rules but in any case ironic, futile or propaganda comments will be completely ignored, starting from now.
All messages are moderated here, this is not a private room for chattering of anyone. Moreover this is not a webspace in which you or someone else can speak about “international conspiracy” or something like this. If you need to chatter about that, many dedicated Blog are available on Internet to speculate.
We are just technicians and scientists interested to science and scientific facts, not conspiracy lovers well known supporters of Defkalion.
Dear Alain Coetmeur,
here you can find the excel file containing the 18 hour test by Mizuno of the pump without any excess heat. This file disappeared from Jed’s repository, for the reason that Jed has just pointed out on vortex.
https://dl.dropboxusercontent.com/u/66642475/Mizuno2014-11-20.xlsx
As the first sheet of the file, you can find a sheet dubbed “mio” that I added. It reproduces Mizuno’s data with an additional column (DeltaT), that is the difference between the water temperature and the room temperature. It is plotted as well.
Draw your conclusions by yourself before speaking of conspiracy.
What do you have to answer to the critics that the diameter used for the pipe is not the same ?
how did you check the pressure difference was the same ?
what is the most probable, that you replicated imprecisely, or that the calibration curves, matchin some pump failure event, was victim of a strange artifact ?
Occam razor simply says you make a mistake not in the calorimetry, but in the replication.
that is easier to accept that an artifact between calibration and run.
keep it simple.
Alain Coetmeur
@ Alain Coetmeur
We are performing also a measurement using a 10 mm pipe. Report will pubblished here soon as reply.
Meanwhile (keep it in simple) we remeber to you that up to now Jed Rothwell has not restored the disappeared Excel file:
http://lenr-canr.org/Mizuno/Mizuno2014-11-20.xlsx
of which we have copy, where the calibration data of the pump, over a long time period, were showed. In that spreadsheet it was clearly evident that the water temperature increased a lot compared to the ambient.
Occam razor could say that it’s quite strange that (recently) disappeared just that spreadsheet from Rothwell’s repository, only that within a group of six Excel test data files. You might press firmly the author in order to restore and publish it again (in its entirety) and explaining all temperature data and results over the complete period.
so you say fraud.
easy.
all is fraud thousands of fraud…LOL
what is Jed justification ? you asked ?
Message to the nickname “AlainCo”
You posted again a comment here not following our rules and moreover you forgot that on 07 January 2015 Rothwell wrote:
“I do not have the time or the inclination to deal with such people.”
so he prevented communication, not us.
We asked in order to get due scientific transparency.
Again, we are not interested to have discussion with you about “conspiracy” or “fraud” and so on, arguments that you continue to invoke and chat elsewhere.
If you are able to give a real technical-scientific contribution to the work OK, otherwise please follows our technical discussions without sending again useless and/or unnecessary comments.
In case that you insist here in future again on these topics, outside of any interest in this site, will be moderated.